")

Make your own investment fund with your expected optimal risk and reward – Yes, you can


WHAT IS THE LIKELIHOOD OF SUCCESS OF STOCK-TRADING ACCOUNTS?
In the end, the fluctuating historical values of your investments determine the expected risks and rewards. Every investor needs to account for these historical values in his annual tax returns. In addition, the tax authorities can ask for all your transactions in your trading account. You better have this list of transactions well-prepared. Usually, your broker provides such a list. Most traders have heard of the statistics that about 95% of all stock-trading accounts lose money. See VantagePointTrading for a recent referral. This 95% would include professional investors. This 95% would also include account holders of crypto currencies (Distribution of wealth). Stock investing would be only profitable for the happy few. With statistical expectations of investing appearing exceptionally low, this still leaves ample room for the psychological expectations being kept very high by all sorts of advertising activities. Are people being misled? It is remarkable that a broker usually does not provide a daily or weekly chart of the progressing Net Liquidating Value (NLV) of your trading account. A chart tells you more than a thousand words or numbers. Such a chart shows you within the blink of an eye whether you belong to these happy few or to the gray mass. To win a game where normally the chances of winning are statistically limited to only 5% requires more than just a quick gamble and a sweat out of your losses. The taste of success can become so addictive that it may lead to your own demise. This small probability stands in remarkable contrast with the probability that companies create long-term investor value above their IPO’s. These latter probabilities can simply be calculated by DigiFundManager with progressing time by realizing that all IPO’s are normalized to “1”. By calculating the ratio of screened and unscreened stocks where screening is on adjusted share prices larger than “1”, the weekly probability can be charted as follows:

Fig. 1: Probabilities of success for investors’ stock accounts (green curve) and for adjusted share prices of company stocks relative to their IPO’s (red curve) starting on April 2007, the onset of the credit crisis. A minimum daily-dollar volume of US $0.1million is assumed for the stocks.
How can you push more for your own luck and share more in the success of companies transcending their IPO’s?
ARE PERCEIVED RATHER THAN RATIONAL RISKS DRIVING INVESTOR DECISIONS OF CONSUMERS?
The law gets what it deserves. Recent research by Stefan Zeitbergen of the Radboud University in The Netherlands in collaboration with the Dutch Authority of the Financial Markets (AFM) supposedly revealed that risk perception rather than rational risks drives investment decisions of consumers. The research surveyed 757 people, part or all of them of the so-called consumer panel of the AFM, at the time a group of about 2000 people who were invited by the AFM to sit on the panel. The survey appeared to be structured as to aim at answers supporting the idea that perceived risks would drive investment decisions. You get what you measure. However, statistics can never give compelling evidence of causal relations such as between perceived risks and a decision-taking process. Is it not somewhat misleading to conclude that risk perception drives investment decisions? In whose interest was this survey? How can members of the consumer panel learn and benefit from this survey? The AFM tried to answer this question with her earlier survey of 500 of the roughly 1 million self-investors in The Netherlands at the end of 2015. This latter survey distinguished between two investment-decision processes: to choose rationally based on Rational Choice Theory (RCT) or to choose with psychological preferences. According to JP Morgan, professional fund management makes rational choices about screening, ranking, timing and weighting as to balance the impact on risks and rewards. These four processes can be digitized in a relatively simple manner. An investor should always have a tool at his disposal that provides him with rational and quantitative insight on the impact of his rational choices, personal circumstances, and investment objectives on his expected risks and rewards. DigiFundManager is such tool. Such tool gives him a benchmark. The program defines risk as a maximum drawdown rather than an a multitude of standard deviations as spread in an assumed distribution function. The latter definition makes sense when the distribution function can be considered as being Normal, but that is an invalid assumption. We wouldn’t discuss such issues if the concept of risk was clearly defined by lawmakers in a rational rather than a qualitative or psychological manner independent of distribution functions. The law gets what it deserves.
DAILY OR WEEKLY CHARTING YOUR NLV OF YOU BROKER ACCOUNT – Blockchain makes it happen
When you trade stocks, just try charting your moving daily or weekly NLV of you broker account. Use the daily or weekly closings. Trading at Market on Close (MOC) is offered by many brokers. That is why end-of-day (eod) prices represent verifiable liquidation values. The maximum drawdowns in your fluctuating NLV usually happen at times of economic busts. The trend of your fluctuating account value is determined by the average positive or negative slope over the timespan of your datapoints. The annualized average is often called the reward and the maximum drawdown is often taken as a measure of risk. Trends, averages and maximum drawdowns can be calculated from historical values with relatively simple algorithms.
EXPECTATION VALUES FOR THE FUTURE ARE AVERAGES FROM THE PAST
Statistical future expectations are averages from past performance by definition. Average annual growth rates of about 7% over the past 30 years with maximum drawdowns of -56% during recessions are the key statistical figures of the grand American Indices, the DJIA and the S&P500. From a statistical point of view, you may expect similar statistical behavior during the near future. Statistical expectations don’t give any deterministic warrant for the future. The statistical behavior of the Indices is in fact not any different from the behavior of your own basket of stocks. The stocks in the slowly changing compositions of the baskets of both Indices are weighted in their own specified way. Both weighting systems change with changing share prices. Having slowly or rapidly changing stock compositions in your own basket doesn’t make any difference for the algorithms calculating the risks and rewards. Stock weighting in a basket or stock portfolio is no different than determining the amount of money you invest in each stock. Equally weighted implies that your basket of stocks contains the same amount of money for each stock at the beginning of each week. This implies that each stock has a different number of shares during a holding period of a week. At any moment, the value of equally-weighted portfolios equals the weighted average of the inverse of the historical share prices. In that case, the weighting factors equal the number shares per dollar value. Weighting can have a significant influence on your risks and rewards.
WEIGHTING INFLUENCES EXPECTED RISKS AND REWARDS
The following chart illustrates the importance of portfolio weighting:
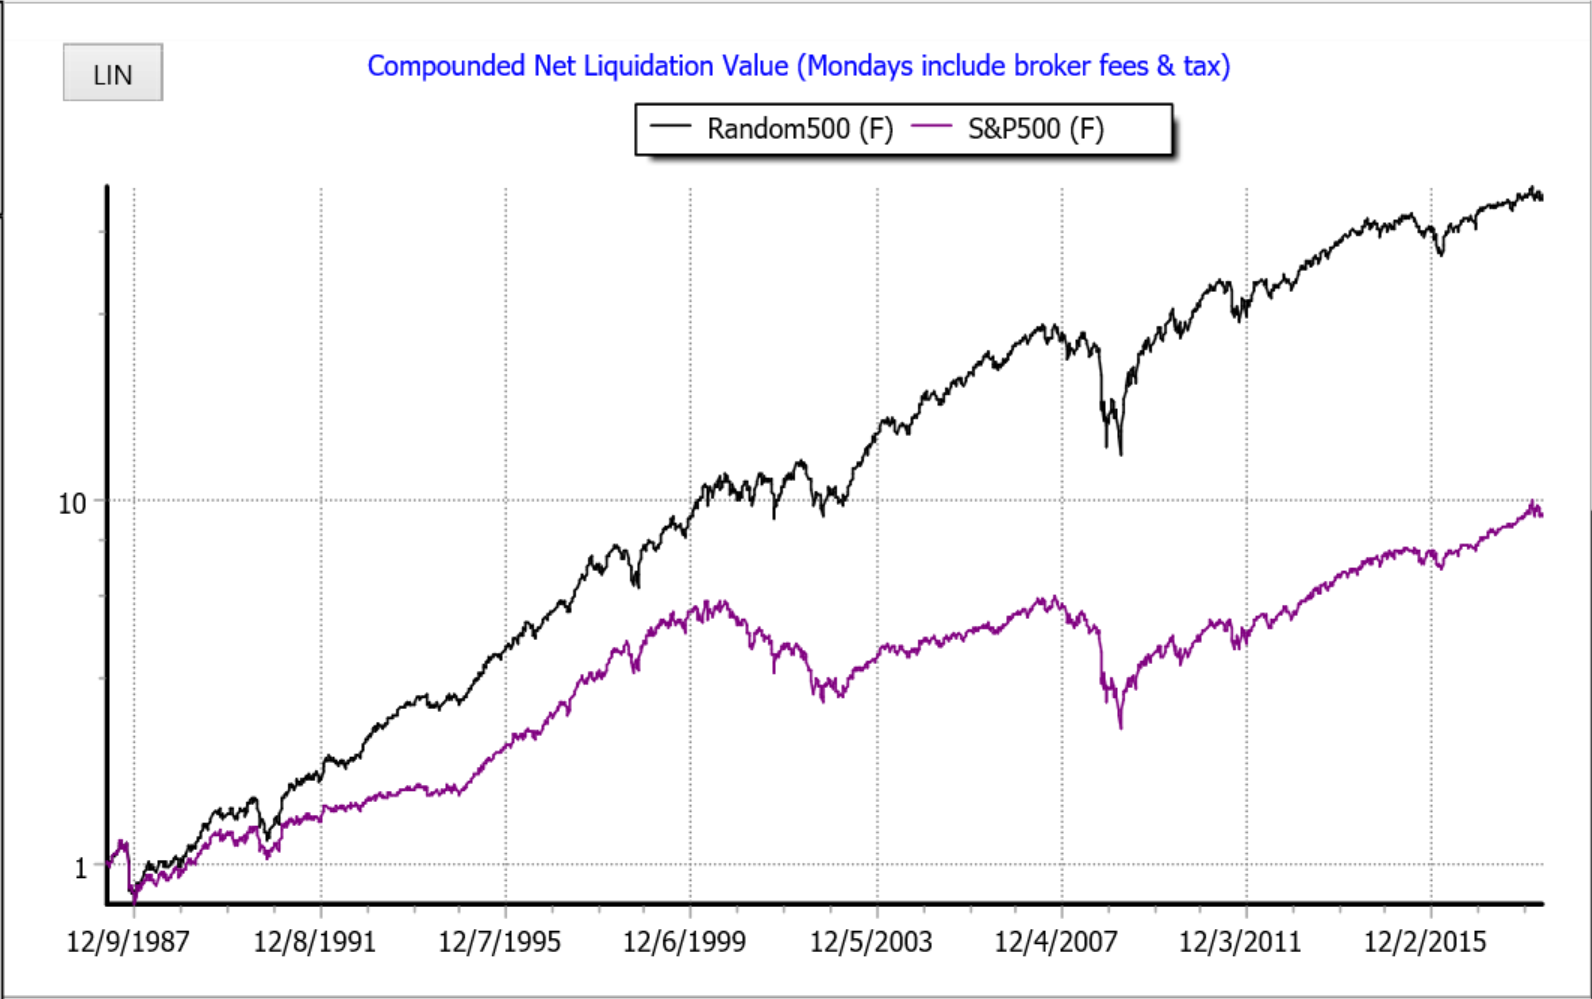
Fig. 2: Difference between the equally-weighted Random500 (black curve) and the cap-weighted S&P500 (purple curve), given weekly on Friday closings during the past 30+ years prior to 14-April-18, both Indices being normalized to US $1 at start.
The Random500, or also called the Monkey Index, show the compounded values of baskets of 500 randomly picked stocks on Wall Street that are registered actively traded stocks with the Securities and Exchange Commission, the SEC. In addition, we required that the random picks all had an average minimum daily dollar-volume of US $1million/day. The difference in rewards between the two Indices is roughly a factor of two in favor of the random500. The risks on those rewards are about equal and amounting to roughly -56%. The large difference in annualized results has little to do with the picking accuracies of a Monkey versus that of Standard & Poor. The weighting makes the difference. When weekly picking and equally-weighting the 500 members of the S&P500 screened for the same liquidity condition during the past 30 years, you get roughly the same risk and reward as the equally-weighted Random500.
OPTIMIZING EXPECTED RISKS AND REWARDS
The chart of Fig. 2 suggests that it should be possible to optimally weight stock portfolios as to optimize expected risks and rewards. Such portfolios are called optimal portfolios. Optimizing portfolios at a time series of specified trading times does not necessarily imply that this time series generates lower risks and higher rewards than the same time series of price-weighted or equally-weighted portfolios. However, validating time series of optimal portfolios and benchmarking these with the corresponding equally-weighted and price-weighted portfolios shows that optimal portfolios most often outperform the other ones in terms of risks and rewards. Optimizing weighted averages for each personal investment scheme is indeed possible with relatively simple algorithms. It does not require rocket science to number crunch the optimal stock allocations in an optimization process of your own investment objectives. We return to this subject later. Brokers often show you the fluctuating Indices in all sorts of flashing charts with progressing time. That also holds for individual stocks. That does not often happen for the historical development of the NLV of your own changing basket of self-weighted stocks. DigiFundManager does that automatically for you.
ARE UPS-AND-DOWNS OF ALL TIMES – MEAN-REVERSION
Fluctuations and averages are statistical concepts. Is this statistical behavior of ups-and-downs of all times? Financial experts point out that statistical variations of investment results are not a random walk. Periods with negative results are systematically followed up by compensating periods of positive results. Economist state that periods of opportunities are followed up by periods of threats. Investment strategies that play into such fluctuations are called “mean-reversion”, the continuous returning to the moving average. Conversely, we see the application of trend-following investment strategies. These latter trading schemes originate from technical analysis under the theme “the trend is your friend (until it bends)”. The consistent validation or back testing of trend-following strategies shows an unsustainable behavior for already 30 years. It is being observed that technical as well as fundamental indicators have a limited shelf life with a relatively short alpha-decay time. They appear to work over certain times, and then unpredictably stop working. These short shelf lives are sometimes explained by the efficiency of the markets. The taste of fortune can work addictive. There’s no accounting for taste.
THE TREND-FOLLOWING SYSTEM OF SUPERFUND
SuperFund from Vienna manage a number of quantitative hedge funds. The continuous reselection and rebalancing of portfolio positions takes place on a daily basis and are determined by proprietary algorithms. These hedge funds allow for smaller subscriptions of the retail investor. SuperFund apply trend-following indicators originating from technical analysis. The rewards they show are lightly negative over the past four years. The risks are reasonably managed. Their software for charting and fundamental information is given by their program TeleTrader. The standard edition is for free. The program is a fantastic source of very diverse financial information with a really beautiful graphical user interface. SuperFund claim that they introduce a new generation of hedge funds where they cover or hedge their long positions with corresponding short positions from the future markets so as to decimate their risks.
ARE RETAIL INVESTORS ABLE TO ENDURE A RISK OF -56% ON AN ANNUALIZED REWARD OF 7%?
The fact remains that retail investors or small consumer investors usually don’t survive -56% drawdowns in significant parts of their net worths. Even professional investors can then be forced into bankruptcies. They may call on the support of the tax payer when the government considers them too big to fail. The latest financial crisis shows some clear examples of that across countries. The retail or private investor doesn’t need to count on government support during economic busts. In many countries, the financial law distinguishes between consumers and professionals. Professionals are market entities such as banks, brokers, professional investors, and nowadays data providers. Europe has its MiFiD2 rulings, the so-called “Markets in Financial Instruments Directive”. The US have their Securities and Exchange Commission, the SEC. Market entities that actively manage financial products on public financial markets need to be registered with such supervising monitoring bodies. These parties have their own duty of care for consumers. They must make their transactions and management transparent for their clients and tax authorities. It should make transparent the total financial game. The blockchain technology in principle enables the instant transparency of all financial transactions or part of it. You may then be able to see the fluctuating net worth of each country and the entire world every second. With the shortening of the observation time, volatility increases with increasing short-term opportunities and threats. The financial sector is in for some changes, like the changes in physics with the introduction of Heisenberg’s uncertainty principle roughly a century ago.
THE PREDICTABILITY OF THE ECONOMY OF KONDRATIEV
As already stated, expectation values for the future are no different from averages of the past. Averages are fluctuating much less than historical values that are measured every second or daily. A mathematician calls every collection of weighted value changes in stocks or other assets a solution space. Economists and financial experts may ascribe certain economic laws to the future behavior of such a solution space. In 1938, the economist Nicolai Kondratiev was convicted for the second time by the Stalin regime and died facing the firing squad. To ascribe economic law to the future behavior of a solution space implies that future movements are subject to certain conditions and become predictable. Kondratiev appeared to foresee that capitalism creates prosperity that comes in waves with periods of 50 to 60 years. In 2020, we would then again approach an inflection point with the worldwide tsunami raging at its strongest force over the financial markets. However, according to the Stalin regime, capitalism would blow up itself in a downward trend, and it was an act of blasphemy or against the teaching to think otherwise. You can hear the financial fortune tellers predicting that the upcoming stock-market tsunami will first draw European money to Wall Street and then Japanese money when these economic powers are blowing up themselves. That would initially cause a strong value increase of the US dollar and gold. At the moment, it is only a thought.
VERIFYING IN HINDSIGHT OR BACK TESTING FUTURE PREDICTIONS
Expectation values for the future or averages over the past only obtain a predictive working when extra financial or economic laws are imposed on these moving averages. It is no rocket science to verify from the calculation of such moving averages whether such conditions are implied in the calculated curves. You then enter the areas of econometrists, signal processors, and game theorists. Such laws or imposed conditions are considered as assumptions or hypotheses in science but could also be laws of physics. Such assumptions are then tested elaborately on the basis of historical data. To test the effectiveness of such assumptions, you need long time spans and lots of CPU power. Nowadays, you are able to perform a validation or back test over 30+ years multiple times on a simple laptop within a blink of your eye.
THE VOLATILITY OF THE VALUE OF A DOLLAR COMPANY EARNINGS ON WALL STREET
Robert Shiller, an economist and Nobel Lauriat, shows the varying number of dollars, corrected for inflation, paid for one dollar of company earnings of the S&P500 companies during the past one and half century. The exchanges are volatile during recessions when earnings are becoming scarce. During recessions, you see the price per dollar earnings strongly rise. Robert Shiller calls that irrational exuberance. The current price of a dollar earnings of the S&P500 is US $24.18 compared to US $15.70 as the average over the past one and half century. This would indicate that Wall Street is presently 54% overvalued. In this context it may be interesting to show the volatility of the Monkey Index over the past half century. This curve can be simply calculated from the standard deviations of equally weighted weekly results of the 500 stocks randomly selected from a list of 7000 presently active stocks on Wall Street and registered with the SEC. The next chart shows the result.
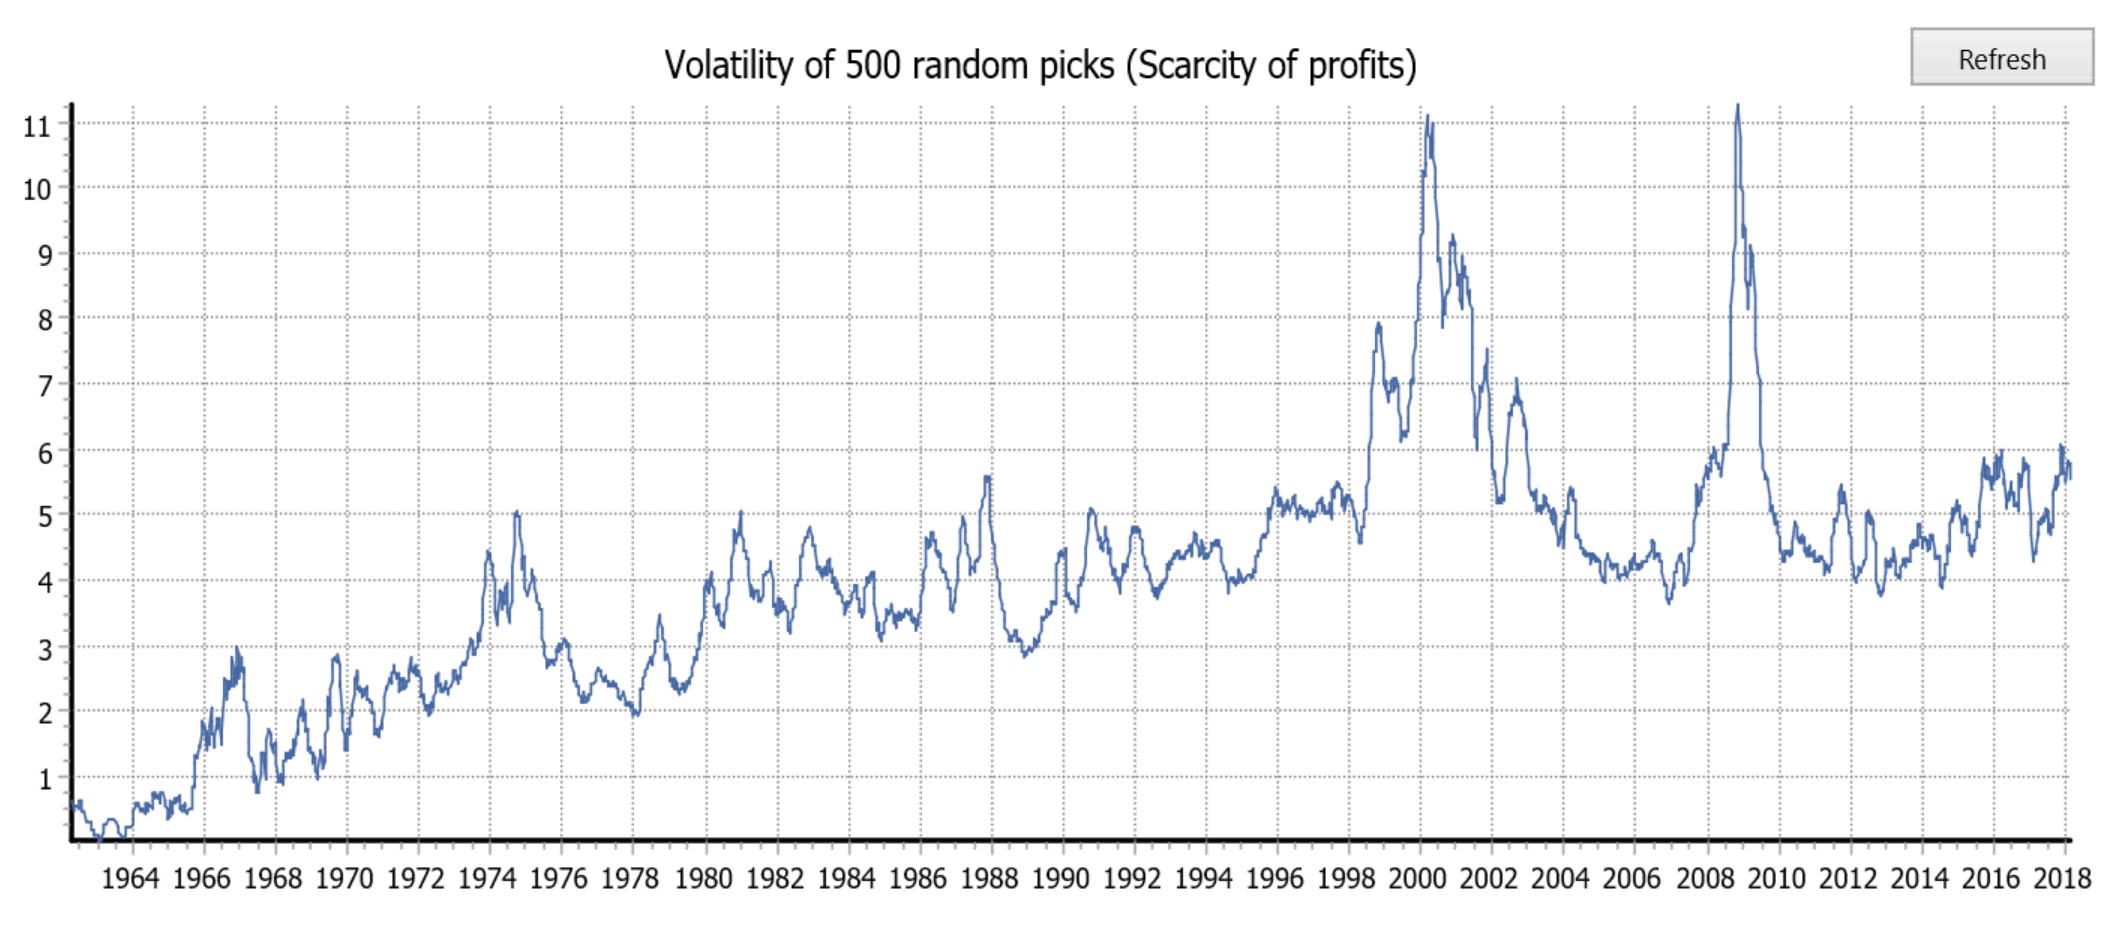
Fig. 3: Volatility calculated from the equally-weighted Monkey Index over more than half a century; the calculated values are smoothed with a 14-weeks midpoint-smoothing algorithm.
The two largest peaks in Fig. 2 show the Internet crisis and the Financial crisis in 2000 and 2008/9. “Black Monday” is also visible as a small peak towards the end of 1987. It is reasonably far-fetched to perform a spectral analysis on such charts to recognize or even validate the Elliott and Kondratiev waves.
POSSIBLE ECONOMIC LAWS ARE INCLUDED IN YOUR EXPECTED RISKS AND REWARDS
In essence, an investor is mainly interested in his expected risks and rewards. Everyone knows that future exchange movements are fundamentally unpredictable. To try discovering sustainable predictors in the form of technical and/or fundamental indicators will always stay a discovery journey into the dark. Every professional financial analyst must legally state that the historical data only enable the calculation of expectation values, which don’t give any guarantee for future performance. A life expectancy of 83 years doesn’t say anything about the age that any particular individual will reach. The life expectancy is determined as an average of historical data.
FUTURE ESTIMATES OF THE PAST ARE INCLUDED IN THE EXPECTED RISKS AND REWARDS
Future estimates and guidance statements of analysts, economists, politicians, sociologists and company executives don’t give any guarantee for future performance. It is a fact that future estimates at the time of reporting influence the short-term value fluctuations on the exchanges. When only you would know these estimates a day ahead of publication, you could make a lot of money by betting on the outcomes. However, enriching yourself in that way is not legally allowed, as that is considered as trading with foreknowledge. The current bandwidths provided by Internet Providers enable your laptop to practically instantly pick up the moving historical exchange data. Practically instantly you will be able to calculate the compositions, weightings and timings of your optimal portfolios with the expected risks and rewards. Technical and fundamental analyses don’t add anything to optimal timing and weighting of portfolios.
YOUR INVESTMENT OBJECTIVE OPTIMIZES YOUR EXPECTED RISKS AND REWARDS
A trader or investor must plan in advance for his investment objective: does he want to minimize his risks, maximize his rewards, or minimize his risk/reward ratio for each moment that he wants to trade. The numerical processes of optimal timing and weighting are equivalent to a lot of number crunching, so that they are CPU-intensive. A modern laptop and desktop are well-equipped to run a relatively simple search algorithm to search for the optimal timing and weighting conditions of screened and ranked portfolios. Such a search algorithm is called a search engine. To search for an optimum one usually applies so-called estimation techniques. Estimation techniques are the areas of interest of econometrists, signal processors, and mathematicians.
THE ACTIVITIES OF AN INVESTMENT MANAGER
An investment manager is in a continuous process of sequential investment decisions to compose portfolios, possibly from a larger list of candidates called a watchlist. First, he has to screen this larger list for candidates that have adequate trading liquidity, and he may have additional screening criteria. Second, he will have to rank the screened selection in terms of decreasing likelihood to increase in price. Third, he will use some kind of number crunching technique to time and weight his portfolios. A “classical” investment manager uses his professional insight to judge the information given by his team of analysts to screen and rank his portfolios. Nowadays, he will use a computer to further support his judgment. The screening and ranking can also be done by only using historical exchange data. This numerical process is called “data mining”. The difference between both methods is the difference between making classical and quantitative investment strategies. The competition between classical and quantitative investment strategies will possibly develop as in playing bridge and chess. In the end, the classical players will not be able to win anymore from the software to which they themselves contributed. Bloomberg shows in fact that this battle has already been fought. To illustrate the outcome of that battle, we compare the classical Zacks ranking system with the purely quantitative system of EnterErgodics.
ZACKS RANKING VERSUS ERGODIC RANKING
Zacks ranking is based on the estimate revisions of about 3000 analysts that are associated with about 150 brokers. At any moment, they are monitoring over 200,000 estimates of company results and other related data. Zacks are trying to search for any changes or revisions in those estimates. They continuously determine the consensus of those estimate revisions and rank the size of the change as a measure of probability of success. The larger the change, the lager the probability of success. Stocks with rank #1 are seen as “strong buys”. Stocks with rank #5 are seen as “strong sells”. Zacks database contains about 5000 active stocks and all inactive stocks from 1999 onwards. Every week, on average 238 active stocks are given rank #1. In the following chart, the equally-weighted 238 “strong-buys” of Zacks are compared with the 250 highest-in-rank stocks of EnterErgodics over a period of over 18 years. Ergodic ranking is based on historical closing prices. First, the 7000 stocks that are presently active on Wall Street and registered with the SEC are screened for a minimum average daily-dollar volume of US $1million. The largest fallers over a correlation time of one week are the highest in rank in the remaining collection of stocks.
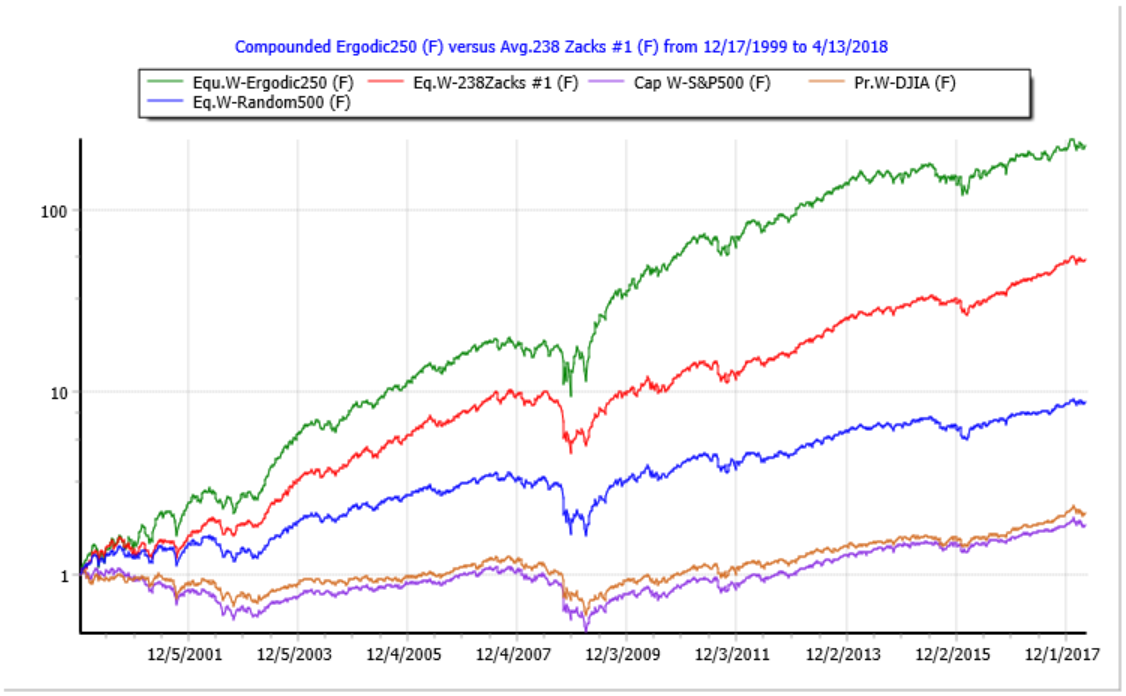
Fig. 4: The weekly compounded equally-weighted results of the 250 highest-in-rank stocks of EnterErgodics (green), the equally-weighted 238 “strong-buys” of Zacks (red), and the compounded weekly results of the equally-weighted Random500 (blue), the price-weighted DJIA (brown), and the cap-weighted S&P500 (purple).
The charts with the underlying numbers show that Ergodic ranking (green curve) outperforms Zacks ranking (red curve) by roughly 10%/year. Ergodic ranking is purely based on historical end-of-day prices of Wall Street. An experienced eye may observe that both ranking systems show about equal performance from 2013 onwards.
INVESTMENT SOFTWARE FOR QUANTITATIVE TRADING WITH LIMITED RISKS AND MAXIMIZED REWARDS
Quantitative investment software is often proprietary and tailor-made like the software of Renaissance Technologies and SuperFund. For the retail investor, a few software packages are available like SmartQuant, QuantShare, DLPAL, and DigiFundManager. The last one is a Dutch product, and is the only one that automatically selects and ranks long with matched short positions at specified times in line with your investment objective and validates the risks and rewards of the optimal portfolios over 20+ years. The pioneer of quantitative investment strategies is the American mathematician Jim Simons. In 1982, he founded his company Renaissance Technologies to try out his luck on the financial markets. According to his own saying, during the first years he developed his quantitative trading algorithms. According to Bloomberg, from 1988 onwards already for 28 years, the net annualized results of his famous Medallion hedge funds were on average 41% with a maximum drawdown of – 4.1%. Bloomberg reports that Renaissance technologies has US $85billion of assets under management in 2018. The unique feature of such algorithms is that they combine long and short positions such as that risks are minimized and rewards are maximized. With such combining, the lesson of the London Whale incident can be used in that harvesting apple orchards should not be hedged by shorting the harvests of orange orchards. During small and large corrections of the financial markets, damage control can be quite effective when using the proper hedging partners. With properly configured screening and ranking, your timing and weighting of your optimal portfolios can be set to result in expected risks and rewards that are roughly the same in size validated over 20+ years. Expected annualized rewards are than well-balanced with the risks. That means that when selecting a broker for facilitating the trading of your validated optimal portfolios, you don’t only need to be able to trade on market closings but also to trade your watchlist as both long and short positions.
MAKE YOUR OWN FUND WITH WELL-BALANCED RISK REWARD RATIOS
Suppose that your investment objective is to generate a well-balanced risk/reward ratio of roughly “1” over the long term. When realizing such objective, the progressing NLV of your portfolios will keep ascending in contrast to the typical Indices, which may be ranging over prolonged periods of time. The risk/reward ratio can be considered as an alternative to the inverse of the Sharpe ratio, which is often used in the financial world. Why not asking your financial advisor about the investment objectives of validated risk/reward ratios of his investment funds, where risks are considered as the maximum drawdowns during economic busts? It is remarkable that these numbers are often not made transparent to the retail investor. Do the laws adequately protect consumers in that investment risks don’t need to be quantified other than “you can lose all your money”? Since the ground-breaking work of the Nobel Lauriat Sharpe, you would expect that lawmakers would formulate such a quantitative concept of risks and rewards in some way or another into financial law.
IMPORTANCE OF FINANCIAL BREAKING NEWS VERSUS INSIGHT IN INVESTMENT STRATEGIES
A private investor who wants more than the taste of luck of a quick gamble is better served by studying the various investment models rather than immersing himself into the endless stream of breaking news. The endless stream of breaking financial news has become an important business activity of Reuters and Bloomberg. Does all that news help you with the regular screening, ranking, timing, and weighting of your optimal portfolios? For the time being, you mostly need a complete and affordable broker, a reliable and affordable data provider for the historical exchange data, and an efficient and effective investment software program. That investment program should enable you to automatically compose optimal portfolios tuned to your own choices for configuring screening, ranking, timing, and weighting. The calculated time series of these optimal portfolios will then have to be validated in terms of your own expectations of risks and rewards. You should be able to set the validation period such that it gives you sufficient confidence to use your optimal portfolios for your own future trading. Your expectations should be quantified in terms of expected annualized rewards with the maximum risk on that expectation, while keeping in mind that statistical expectations never warrant an individual future outcome. The calculated optimal portfolios with their expected risks and rewards are no investment advice. These calculated quantities are the consequence of your own choices and circumstances, including the choice for a broker and data provider. The algorithms determining the time series of optimal portfolios and the expected risks and rewards are relatively simple. The relatively simple calculation modules are mathematically sound filter, sorting, and optimization engines of a linearized solution space. Thereby, subroutines are being used for the calculation of weighted averages and maximum deviations thereof.
Enter: 18-April-2018