")

Safe investing: Stock portfolios with minimized risks and maximized rewards
Investment funds, Indices (S&P500, DJIA), and ETF’s
Statistically, investment funds, Indices and ETF’s typically draw down in value between -30% and -65% during recessions and crises. Such big risks cannot only jeopardize the route to long-term averages of the larger banks that are too big to fail, but they also can take away the means to live the lives of private and professional investors. Investing in instruments that are drawing down that much is not really safe.
The road of statistics to quantitative finance
Can we understand the market in terms of cause and effect? That would make the difference when riding the ups and downs of fluctuating prices. When Boltzmann faced in 1866 the challenge of understanding the mechanics of a system of volatile gas particles, he simplified the problem by replacing the time average of each individual particle by an ensemble average. That did not yet bring cause and effect into the volatile system. However, it enabled him to calculate the statistical results of populations or ensembles in terms of averages, standard and maximum deviations. It enabled him to avoid performing time-consuming "fundamental" and "technical" analyses in the time domain for each individual particle. He was able to link cause and effect through an equation of motion and test the underlying assumption as hypothesis. Finally, he could choose an appropriate probability distribution function that should fit his historical data. In the 20st century, this statistical approach became the essence of quantitative finance to design game plans helping us to maneuver to balance risks and rewards. This approach enables one to empirically show that there exists no probability distribution function that correctly encompasses the small and large price movements, and that there is no causality between present prices and future prices.
Risk and Reward
According to a recent article in the Wall Street Journal (WSJ), about 85% of all traders use quantitative software to safeguard their investments:
Use software to test beforehand the effectiveness of each idea, tip, and piece of advice.
MiFid2 rules prescribe how to calculate your risks and rewards using historical exhange prices.
You will know your expected maximum risk and annualized reward.
According to Bloomberg, the top performers of hedge funds generated double-digit returns last year when the S&P500 lost -6.2% of its value. All funds used quatitative investment software. Sustainable investment strategies are strategies that withstand in sample testing over several recessions. Everyone knows there are no guarantees in this field. Portfolios are composed based on screening (filter) and ranking (sorting) processes of stocks or other assets. The software available to retail investors is Research Wizard, Porttfolio123, and DigiFundManager. Markowitz and Fama-French have shown how risks can be balanced by rewards using numerical optimization processes. The optimization software availble to the retail investor, even to try it out freely on line is DigiFundManager.
Tips and advices
The professional advisor or investment manager doing business in Europe must follow the MiFid2 rules and calculate the expected risks and rewards of his tips and advices in the prescribed manner. Do we ever wonder whether a tip or advice based on a fragment of public information, hinging on fundamental or technical analysis, can provide sustainable success for an investment strategy? The online brokers that offer so-called Contracts For Difference (CFD’s) report that about 80% of the traders make a loss on such leveraged products. The market parties that provide for these contracts are well served. These products are prohibited in the US. Innovative products like Index ETF’s often offer more benifits to the providers than to the traders trying to exploit them. Seth Klarman's letter to his shareholders in Jan-2019 was stirring the pot on this subject in a thought-provoking way.
Get access to statistical investment techniques
How comes that retail investors all over the world do not have easy access to statistical techniques that minimize risks and maximize rewards on the stock exchanges? If such techniques could not be effective, quantitative funds like Bridgewater, D. E. Shaw and Renaissance would not have performed with double digits rewards in 2018. Statistics of the past determines your success in the future. Quantitative investing can show that.
In 1952, Markowitz already formulated weighting algorithms
Already in 1952, results of stock portfolios were quantified by Markowitz by means of a series expansion of weighted results. The weighting factors can be calculated in a numerical process that optimizes an investment objective for combined long and short positions. For safe investments, the objective is a lowest possible Risk/Reward ratio (or a largest possible Sharpe ratio) over a given time span of several recessions. An optimization process where the Risk/Reward ratio is minimized simultaneously minimizes risks and maximizes rewards.
The extension of Fama-French in 1993
Later in 1993, the optimization process was extended with other risk factors. Such extension was first formulated by the Multi-factor process of Fama-French (1993). The assumptions were that the financial markets operate efficiently and in an integrated manner, and that only a limited number of risk factors describe the expected rewards over the entire world.
The innovation of DigiFundManager
From a mathematical point of view, these numerical optimization techniques are based on regression techniques. The number of computations of such techniques increases quadratically with the portfolio size. Non-linear, quadratic techniques often imply instabilities in optimization processes. Our newest innovations in such techniques have linearized those processes. The stability and effectiveness of the solutions have been improved. The computation time shortened significantly.
Safe investing within reach!
To calculate stock portfolios with optimized Risk/Reward ratios comes now within reach of the retail investor. An example of actual performance during the bumpy last quarter of 2018 with a rebalancing time of once per quarter is shown below and further analyzed under our Markowitz and hedging in action:
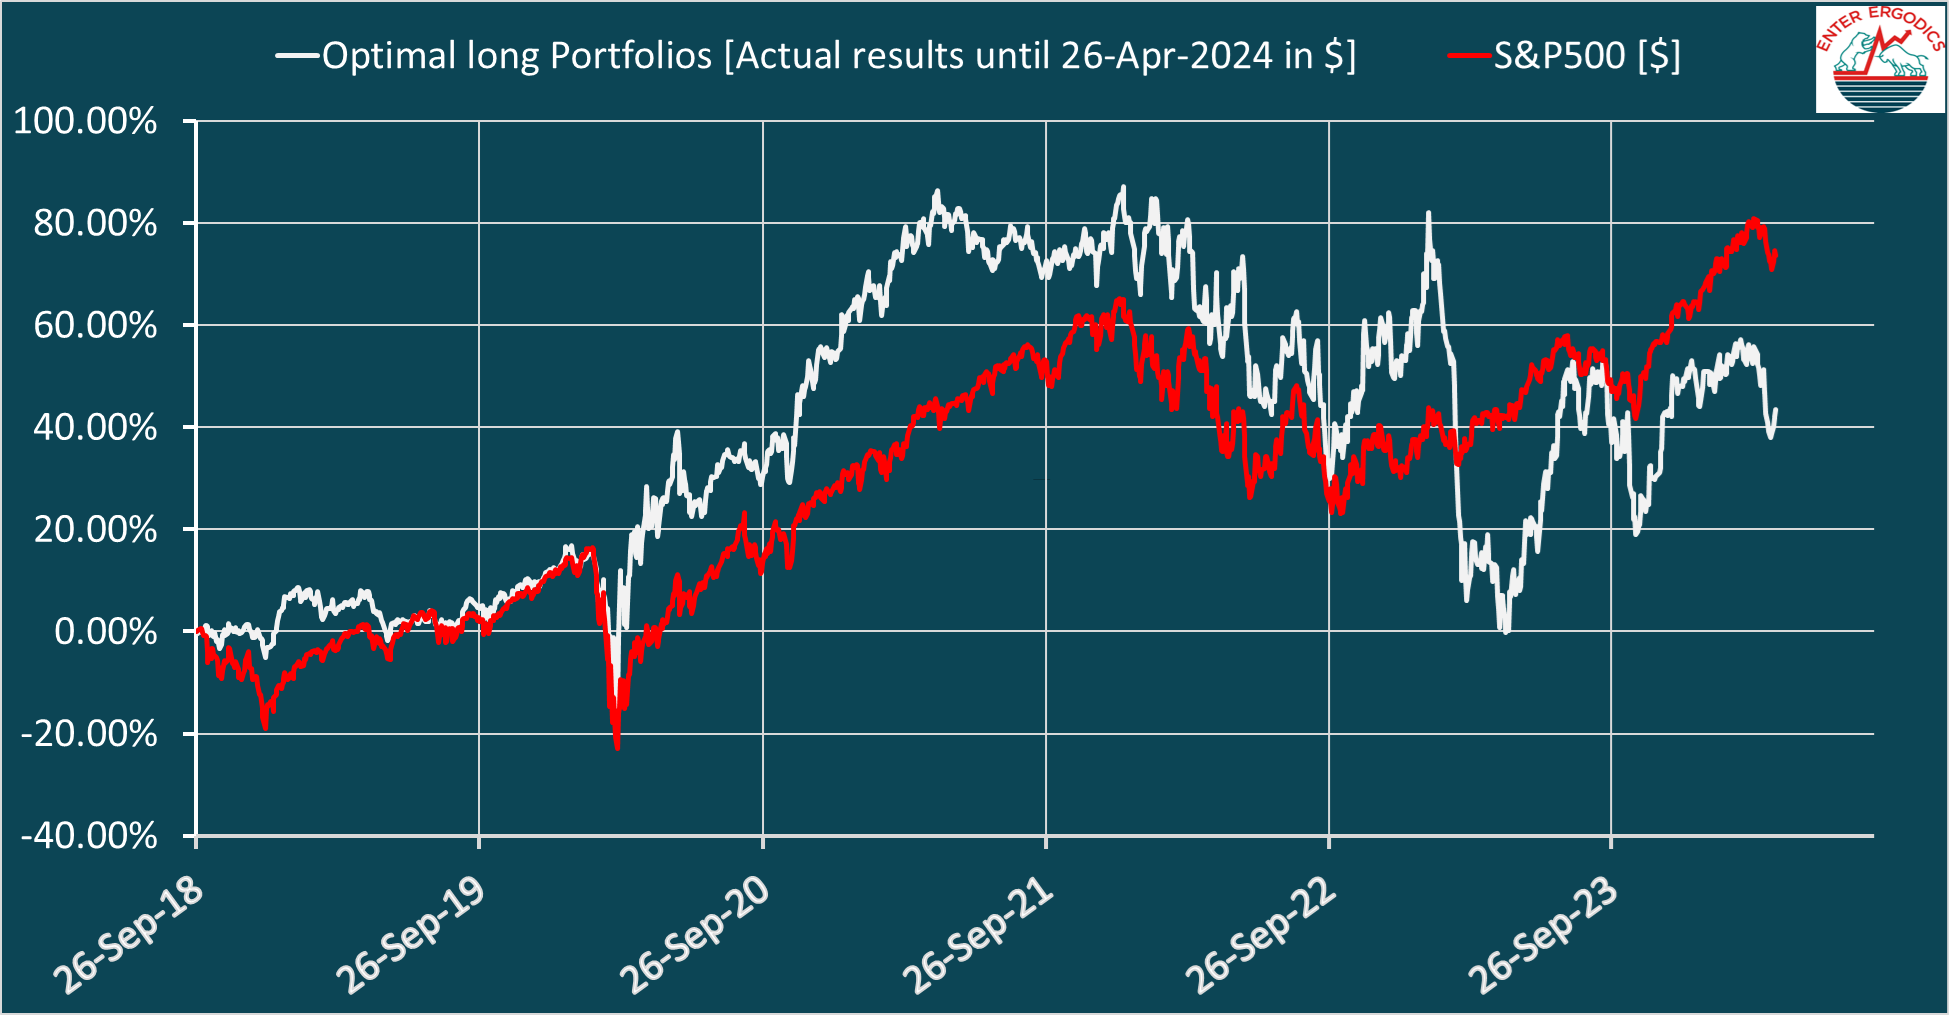
Towards the end of December 2018, the S&P500 had drawn down by about -20%, while our optimal portfolios drew down by -6%. From an ideal point of view, one would not like to go down when the markets go down, while you would like to go up when the markets go up. Our optimal portfolios start to approach that ideal. From a practical point of view, there appears to be no need for the Multi-factor Fama-French solution space, as the single-factor solutions of Markowitz appear to be adequate. In addition, the unrecognizable shapes of randomness of Nassim Taleb (2007) appear not yet necessary to describe the drawdowns.
Every quant is different
Why do portfolio managers of quantitative strategies, the so-called quants, do not achieve consistent results? Robeco claims leadership in the field of quantitative investment strategies. In 2018, they offered about 220 different quantitative stock funds that suffered a loss of -7.8% on average. In 2017, some 189 quantitative stock funds of them made a profit of 14.8% on average. These numbers compare badly with the corresponding numbers of the S&P500: a loss of -6.2% in 2018 and a gain of 19.4% in 2017. In The Netherlands, you have the quantitative stock fund of Ostrica that suffered a loss of -6.9% in 2018. In 2017, it made a profit of 4.8%. The Dutch Magnificent Twenty fund picks the best 20 of the S&P500 stocks using their special rating model and lost -8.1% in 2018. In 2017, it made a profit of 11.9%. Only a few funds of Bridgewater, D. E. Shaw and Renaissance made double-digit profits in 2018. We came close but just did not achieve it as you can read in Markowitz and hedging in action.
The following six aspects of quantitative investing can make the difference:
- Quantitative investing is a matter of digital screening, ranking, weighting, and timing from a stock list of preselected stocks. We call that stock list a Watch list. These four functions should be performed at all holding periods of your choice over a time spanning several recessions. This time span is called a validation period. A time series of optimal portfolios should result over the validation period. That time series should always be back tested over that period. Not every quant applies weighting and timing optimization algorithms, because they are usually time-consuming when scanned over 30 years. However, the consistency of a strategy only becomes transparent when scanned over such long periods. It appears to us that the investment engineers of Robeco follow the markets and Indices with their quantitative strategies. Their funds show similar large value fluctuations. This implies to us that their strategies do not satisfy our conditions for safe investing, nor do portfolios of stocks with the highest Morningstar rating and Zacks ranking. Not every Watch list holds the promise of a time series of optimal portfolios that satisfies our condition for a well-balanced Risk/Reward ratio (RRR) of 1 or smaller. In the beginning of 2018, we collected all 229 stocks in a Watch list from the Zacks $1 ultimate trial service. When we weekly scan with constant investments and some standard screening conditions during the past 10 years (no recession) for the combined top 10 long and 10 short positions, the price-weighted portfolios gave an expected annual growth rate of 19% with an RRR of 1.1. The profit over 2018 was 25%, and in 2019 until 4-Feb-2019 it made 14%. This was after $5/trade commission and 0.6% loan cost for going short. From 5-April-1985, RRR=3.3.
- There is often a vulnerability to over-fitting when more risk factors are fitted simultaneously. The combining of independent individual strategies should then be considered.
- Weighting consumes more than 80% of the computation time but usually determines only 30% of the result or less.
- Timing takes little computational power but usually has a large influence on the result.
- Ranking often takes little computational power but determines about 2/3 of the result. When, for instance, DigiFundManager ranks the top 20 stocks in the S&P500, the result is almost 10% better in 2018 than the corresponding result of the Magnificent Twenty fund. That improvement also holds for the other years of the validation period.
- Screening and ranking often are established on the basis of trends and other indicators from technical analysis (TA). There is no scientific basis for the persistent validity of TA. It is at variance with the fundamental unpredictability of price movements. The literature is growing about failing quantitative strategies based on TA. We apply the ranking system of “regression to the mean” and achieve effective results with it as actual performance shows.
Learn how to exploit the statistics of the past to increase your chances on future success
Try DigiFundManager for free on our site
Jan G. Dil and Nico C. J. A. van Hijningen
8 February 2019